
Step 1: Navigate to the Dashboard
- From the Lupine Home screen, click the Dashboard button in the left sidebar, or click Go to Dashboard in the "Start New Analysis" card on the Home page.
Step 2: Enter the URL to analyze
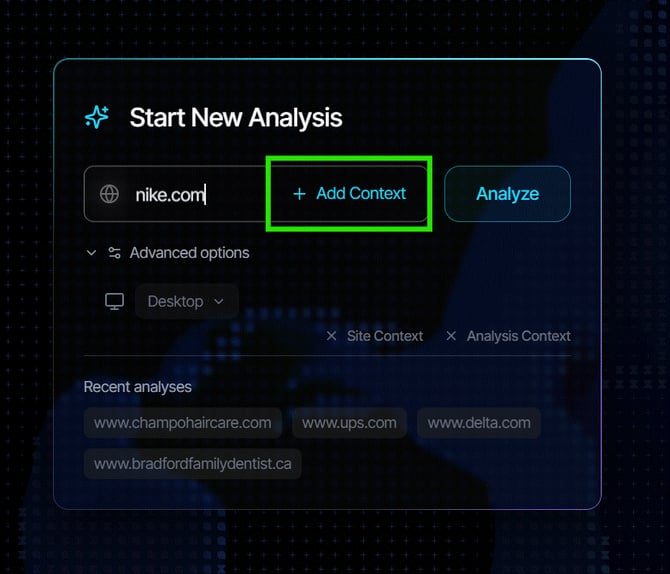
- In the "Start New Analysis" panel on the Dashboard, click into the URL input field (which shows the placeholder https://example.com/page-to-analyze).
- Type or paste the full URL which you want to analyze
- If you wish to Add Context, click on the "+ Add Context" button that shows up. For more information on adding context, please skip to Step 4 of this page.
Step 3: Choose Device Viewport
- Click Advanced options to expand the device selector, then choose Desktop or Mobile from the dropdown menu.
Step 4: Add Context (Optional)
-
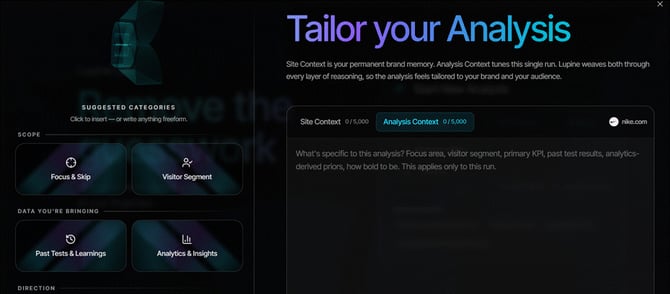
Once you've typed in the URL, select the Add Context link that pops up. This opens the Tailor Your Analysis experience where Site Context and Analysis Context can be configured.
-
Configure Site Context: Tailor your analysis with context that applies to your entire organization, business, or website for this and all future URL analyses. You can populate information such as Brand Voice, Audience, Offer & Business Model, Positioning & Differentiators, Vocabulary, and Constraints. These settings become persistent memory for the site.
-
Configure Analysis Context: Tailor your analysis with context specifically for this analysis run. Define Focus & Skip areas, Visitor Segment, Past Tests & Learnings, Analytics & Insights, Primary KPIs, Funnel Role, and Approach & Creativity settings for the current run.
Add Context Best Practises:
- Keep Site Context updated whenever brand strategy changes.
- Use the Analysis Context to align recommendations with campaign goals.
- Include historical test learnings to avoid repeating unsuccessful ideas.
- Define a clear KPI before running analysis.
- Choose a creativity level appropriate for risk tolerance.
Reviewing Context:
You can review the context for each analysis by selecting the Memory icon in the top-right corner of the analysis screen.
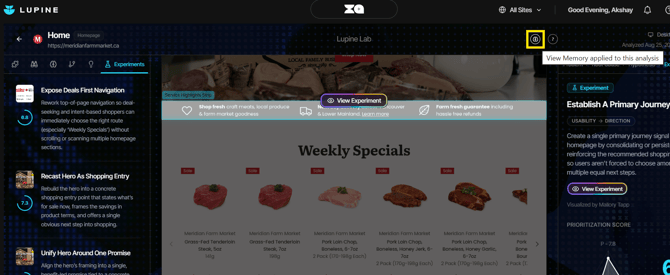
This provides complete visibility into the business context being used by the platform during analysis generation.
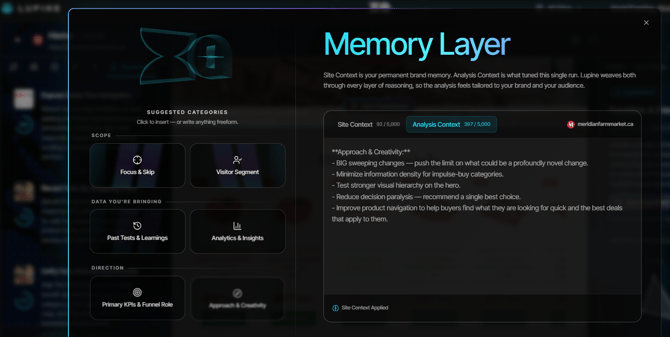
Business Context is woven into every layer of analysis reasoning. By selecting View Memory, users can review exactly which context has been applied to the analysis and better understand how recommendations were generated.
Step 5: Explore the analysis results
- Once complete, you'll see six tabs across the left panel of the results view:
-
- Components — Page-level structural components detected.
- Observations — UX observations identified on the page.
- Problems — Conversion and usability problems found.
- Root Causes — Underlying causes for each problem.
- Hypotheses — Testable hypotheses derived from the root causes.
- Experiments — Suggested experiments with prioritization scores.
-
- Click any item in the left panel to see its details in the right panel, which includes evidence, UX observations, and best practices.