
What is on the cross-platform dashboard?

Click Dashboard in the left sidebar to open Cross Platform.
- Spend by Day shows daily spend as a stacked bar coloured by platform.
- Spend by Channel shows total spend and each platform’s share in a donut chart.
- Last Sync shows how current the figures are.
- Platform Breakdown provides one card per connected platform.
- Top Converters shows the five highest-spending creatives across platforms. Similar creatives are merged, and platform dots show where each creative ran.
- ROAS: revenue per £1 spent. Higher is better.
- CPA: cost per conversion. Lower is better.
- Hook Rate: share of people who watched the first three seconds.
- Hold Rate: share who stayed for roughly 15 seconds or completion.
How do I compare platforms?
In Platform Breakdown, use the metric toggle to switch all platform cards between Spend, Conversions, CPA, ROAS, Revenue, CTR, CPC and CPM. Each card includes a trend against the previous equal-length period and an attribution badge.
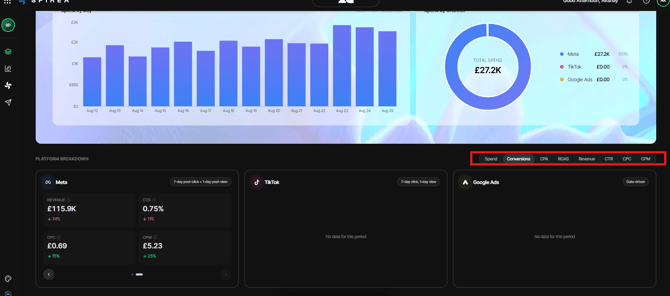
Platforms with no activity appear dimmed. Conversion metrics should be read per platform because each platform may count different events over a different attribution window.
How do I open a per-platform dashboard?
Click Meta, TikTok or Google Ads for the detailed view. Click Back to Overview to return.
Headline tiles depend on the account objective. A Sales account displays ROAS and CPA, while Hook Rate and Hold Rate are always available for the per-platform view.
How do I use the dashboard filters?
The four controls at the top of the dashboard affect every number on the page:
- Date range sets the reporting window and the equal-length previous period.
- Objective determines which KPIs appear and which conversion event is counted.
- Attribution sets the credit window for conversions.
- Currency follows the account selection.
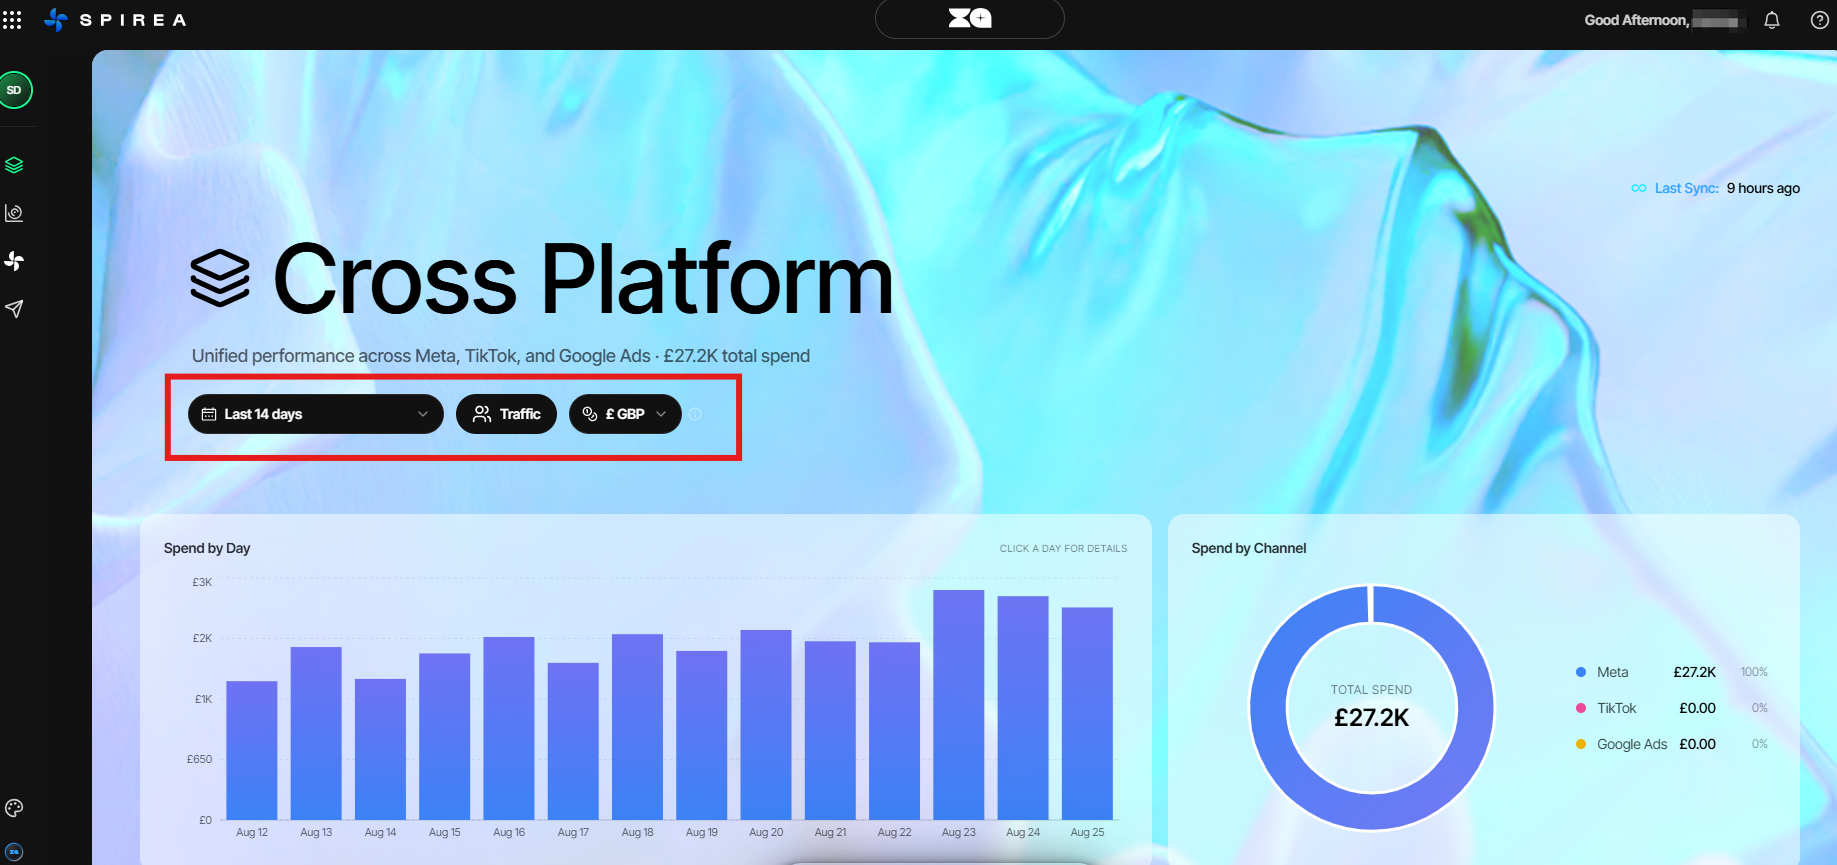
A single account, or multiple accounts with the same currency, stays in its native currency. Mixed currencies default to USD with a banner; you can choose a display currency and Spirea converts figures using daily FX rates.